From our perspective, it’s clear that most teams are working hard to take a more data-driven approach to not only pricing, but decision-making in general. While this is definitely a positive trend, it’s not without its challenges.
In a typical commercial environment, the data we’re trying to work with is often very far from perfect or pristine. After all, there are usually lots of different people and disparate systems involved in both the initial creation of the data, as well as the ongoing management and maintenance of the data.
So it’s no surprise that we have to invest more than a little time and energy into data hygiene and noise reduction. And one of the most common data cleansing and noise reduction techniques is the elimination of outliers.
Outliers are just data points that differ significantly from the other data points in the same domain or dataset. And we will usually eliminate outliers from our analyses because 1) they aren’t representative of the whole or what’s “typical,” 2) they are more likely to be erroneous or corrupted data points, and 3) their inclusion can skew the various calculations we use in our performance reports and assessments.
All that being said, however, it’s a big mistake…and a huge missed opportunity…to get so habituated to eliminating or disregarding outliers in the pricing data that we fail to recognize what those outliers might be telling us.
As we discuss in the The Fundamentals of Effective Pricing Analysis webinar, there are two basic types of outliers that can be very informative and valuable:

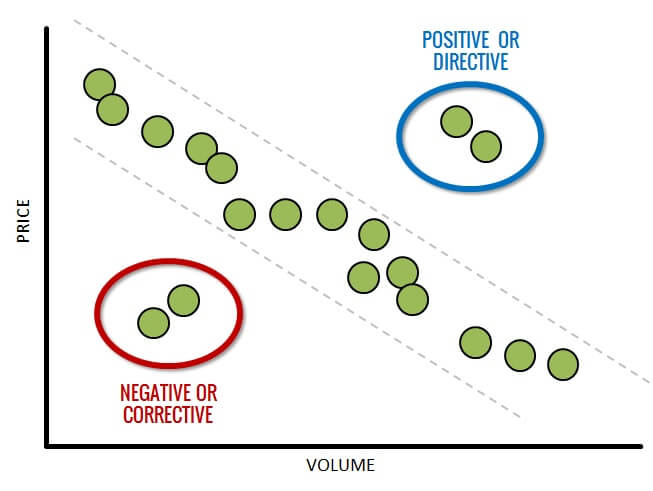
Positive or Directive Outliers are valid data points that are significantly “better” than the other data points in the analysis. These outliers represent outcomes that are not typical or representative, but are desirable nonetheless. In other words, if we could move the entire data set toward these positive outliers, we would.
By studying, interrogating, and diagnosing these outliers, we can learn why they are skewing toward the positive. We can then use the insights we glean to “direct” our teams to do more of whatever is producing the unusually positive outcomes.
In sharp contrast, Negative or Corrective Outliers are valid data points that are significantly “worse” than the other data points in the analysis. These outliers represent outcomes that are not at all desirable or worthy of emulation and replication.
By studying these outliers to identify the underlying causal factors, we can then take action to “correct” those things and prevent sub-par outcomes in the future.
Taken in combination, these outliers can tell us what’s working and what’s not; what we need to do more of and what we need to fix or eliminate altogether.
The point is that while we do need to take steps to keep pricing outliers from skewing or corrupting our quantitative metrics and calculations, we should be interrogating and studying those outliers to glean any qualitative or strategic insights that can help us improve our performance moving forward.


