Very early in my career, I had some experiences that a number of readers will no doubt be able to identify with…
Over time, my team would do a great job identifying and executing some really meaningful pricing improvements. Of course, we fully expected all that hard work and effort to boost to our division’s bottom-line profits.
But then, one of two things would inevitably happen:
- All of the profitability gains we produced were ultimately offset by other things—cost increases, mix changes, seasonal volume dips, and so on.
- All of the profitability gains we produced were ultimately attributed to other things—cost reductions, mix shifts, seasonal volume spikes, etc.
It seemed like we just couldn’t win.
When profits were relatively flat, we knew darned well that our pricing improvements were bolstering profitability in the face of cost increases and volume dips. And we knew that without our improvements, profits would have gone down, rather than simply staying flat.
On the other hand, when profits were way up, we knew that our pricing improvements were responsible for a large portion of those gains. And we knew that what everyone else was saying about cost reductions and seasonal upticks was largely Bravo Sierra.
We knew it…but we had a helluva time proving it!
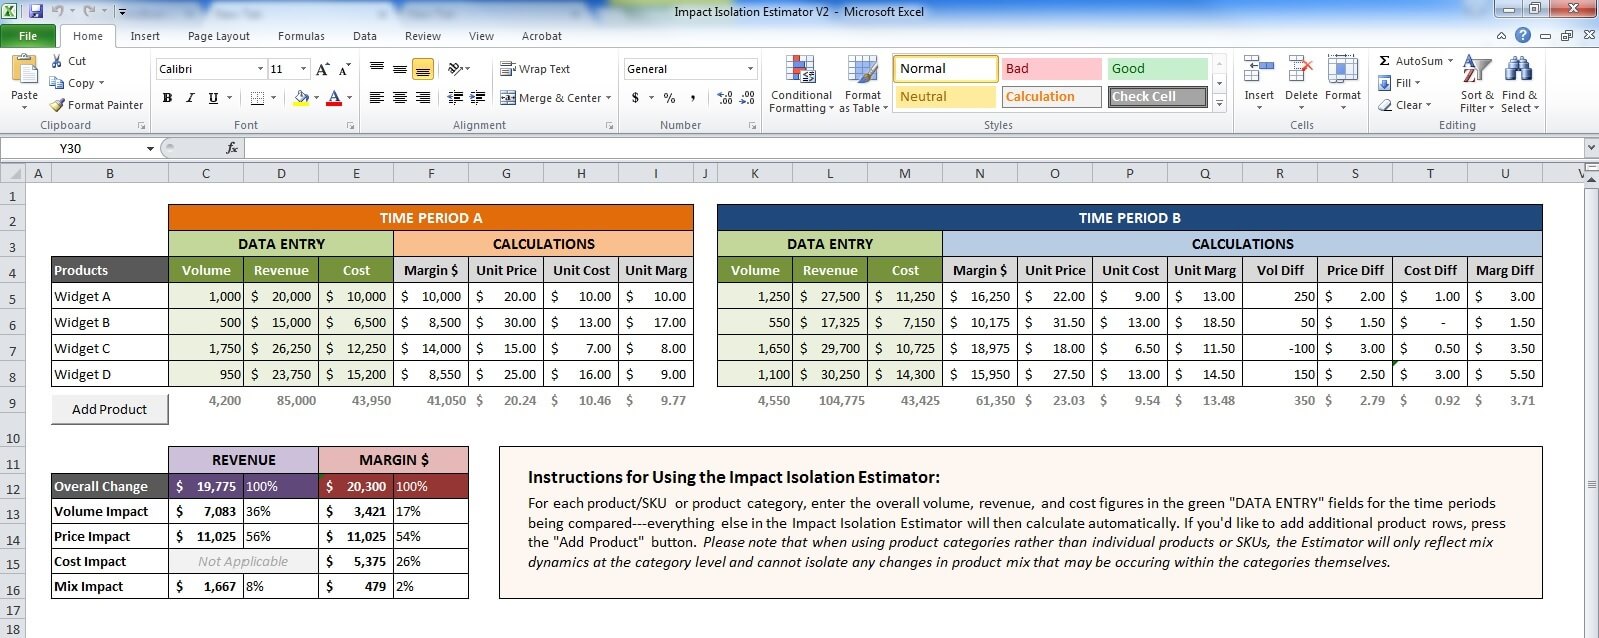
That’s why I was really pleased to see the addition of the Impact Isolation Tool to the PricingBrew Journal portal. Available to subscribers for download, this simple spreadsheet-based tool allows you to:
- Isolate the impacts that volume, pricing, costs, and mix have had on period-over-period performance changes.
- Quantify how much volume, pricing, costs, and mix have contributed to differences in both revenues and margin dollars.
- Identify where changes in product costs have magnified…or mitigated…improvements in realized prices and volume.
- Put an end to the second guessing, skepticism, and in-fighting over who or what should really be getting the credit (or blame).
Thinking back to those early days, I kick myself…hard and repeatedly…for not using a tool like this to measure, quantify, and communicate pricing impacts irrespective of whatever else might be going on with costs, volume, and mix. I guess the cycle of quarterly frustration was clouding my thinking, because something like this just never crossed my mind at the time.
That said, if someone had handed me a tool like this way back then, I’d like to think that even the much younger and less experienced “me” would be able to recognize a good thing when I saw it 🙂
Impact Isolation Tool
Using this straightforward tool, you can finally put an end to the second guessing and skepticism by isolating and quantifying the contributions of price, volume, cost and mix to period-over-period revenue and margin differences.


